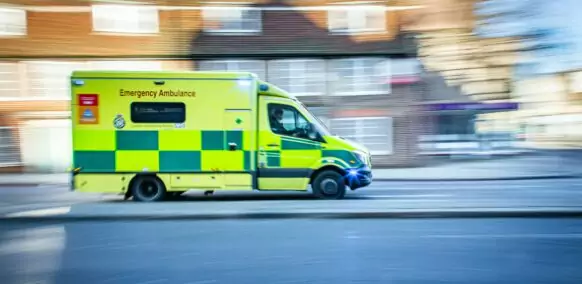
NHS England data shows significant increase in ambulance response times
New analysis of NHS England data by Been Let Down reveals a significant rise in 999 calls and year-on-year increases in ambulance response times.

The Covid-19 pandemic has undoubtedly exacerbated pressure on NHS services, with reports earlier this year showing a record number of people waiting for hospital treatment in England. Our own research into surgery waiting times revealed Leicester, Liverpool, London and Birmingham as the cities with the longest wait times for routine surgeries, with patients at Leicester General Hospital waiting around 80 weeks for some surgeries.
In recent weeks there have also been warnings of lengthy waits for ambulances this winter, as well as reports of significant ambulance handover delays in some towns and cities. We wanted to investigate what current demand for ambulances looks like, and how long patients across England are typically waiting for an ambulance to arrive.
We looked at the latest NHS England data on ambulance services to find out more.
According to the NHS England Ambulance Standards, the current ambulance response goals are:
- 8 minutes for Category 1 (life threatening) incidents
- 18 minutes for Category 2 (emergency) incidents such as strokes
- 120 minutes, or 2 hours for Category 3 (urgent) incidents such as burns
- 180 minutes, or 3 hours for Category 4 (less urgent) incidents such as flu
How long patients are waiting for an ambulance in England
Calling an ambulance usually means you or someone you know are in need of urgent medical attention, so its important ambulance services are well-equipped to meet demand and are able to provide rapid responses to those in need.
To assess the situation for ambulance response times specifically, we have analysed data collected for the NHS England Ambulance Quality Indicator. We discovered that the number of 999 calls requesting an ambulance has increased by a third (33%) in the last 12 months.
The number of ambulances dispatched to deal with Category 1 incidents – these are the most urgent call outs dealing with issues such as life-threatening illnesses or serious allergic reactions – are up by 31% year-on-year, while fewer ambulances are being dispatched for Category 3 and Category 4 incidents, which are deemed less urgent in the NHS priority list. Across all categories, there was a year-on-year rise in ambulances dispatched of 1.3%.
The increased volume of 999 calls for ambulances, and the increase in demand for ambulances for life-threatening conditions, has inevitably affected response times across the country. The average wait time for an ambulance (all incident types) currently stands at 1 hour and 17 minutes, which is up by a massive 88% (33 minutes and 12 seconds) versus this time last year, and it’s more than double (104%) what it was this time two years ago.
Worryingly, as demand has gone up, response times for ambulances dispatched to deal with Category 1, life-threatening incidents have also gone up by 26% year-on-year. This is now sitting at 9 minutes and 1 second on average across England, which is 61 seconds over the goal time of 8 minutes.
The current average response times in England for each type of incident are:
- Category 1 (life threatening) incidents: 9 minutes 1 seconds
- Category 2 (emergency) incidents: 21 minutes, 30 seconds
- Category 3 (urgent) incidents: 2 hours, 35 minutes and 45 seconds
- Category 4 (less urgent) incidents: 3 hours, 7 minutes and 45 seconds
The response goals are not being met in any category area at this time.
Those in the South West face the longest waits
The South West is the area that is currently subject to the longest waits, with an average response time of 1 hour 35 minutes and 58 seconds for all incident types. The response time for ambulances dispatched to deal with the most urgent incidents has also increased the most year-on-year in the South West of England, up 43.1% to 11 minutes and 4 seconds.
London (01:24:40) and the East of England (01:23:25) have the next slowest response times right now.
Meanwhile, patients in the North East & Yorkshire are being seen to the quickest, with a mean response time across all incident types of 56 minutes and 22 seconds. The South East (01:14:17) and North West (01:16:16) are the regions with the next shortest response times.
| Region | Current | 2020 | Change % |
|---|---|---|---|
| Response Time (Mean) All Incidents | |||
| North East & Yorkshire | 00:56:22 | 00:36:21 | 55.0% |
| North West | 01:16:16 | 00:56:12 | 35.7% |
| Midlands | 01:20:30 | 00:30:54 | 160.5% |
| East of England | 01:23:25 | 00:36:44 | 127.1% |
| London | 01:24:40 | 00:34:01 | 149.0% |
| South East | 01:14:17 | 00:40:33 | 83.2% |
| South West | 01:35:58 | 00:52:54 | 81.4% |
The Midlands has seen the highest year-on-year increase in ambulance waiting times across all incident types, up 161% from around 31 minutes this time last year, to over 1 hour 20 minutes. London also saw a significant rise compared to last year, with the current waiting time in the capital up 149% year-on-year from 34 minutes to 1 hour 24 minutes.
Response times for life-threatening incidents are up
The current mean response time for ambulances dispatched to deal with the most urgent incidents, Category 1 (C1), is 9 minutes and 1 second. This varies by region, with the longest average wait for C1 incidents being in the South West at 11 minutes and 4 seconds, and the shortest being in London at 7 minutes and 26 seconds – just below the target time of 8 minutes.
| Region | Current | 2020 | Change % |
|---|---|---|---|
| C1 Response Times | |||
| North East & Yorkshire | 00:08:53 | 00:07:21 | 20.9% |
| North West | 00:09:12 | 00:07:27 | 23.5% |
| Midlands | 00:08:32 | 00:07:24 | 15.3% |
| East of England | 00:09:55 | 00:07:06 | 39.7% |
| London | 00:07:26 | 00:05:46 | 28.9% |
| South East | 00:08:46 | 00:07:09 | 22.6% |
| South West | 00:11:04 | 00:07:44 | 43.1% |
The mean response time for ambulances dispatched to deal with Category 2 (C2) incidents – these are emergency calls for conditions or injuries including burns, epilepsy, and strokes – is actually down 4.7% year-on-year. The outlier is London though, where response times for C2 incidents are up 183.7% to 47 minutes and 54 seconds.
Response times for less urgent incidents have also significantly increased
As demand for ambulances required to deal with life threatening incidents has increased, this in turn is having an impact on waiting times for patients with less immediate need.
Response times for less urgent incidents, Category 3 (C3) and Category 4 (C4), have increased significantly versus this time last year. The response time for C3 incidents is up 133% to nearly 2 and a half hours (02:25:45), and the response time for C4 incidents has increased 172.2% to over 3 hours (03:07:45). In both instances, the target response goals of 2 hours for C3 incidents and 3 hours for C4 incidents are not currently being met
The region with the shortest mean response time for C4 incidents is the North East & Yorkshire (01:59:38), while the longest mean response time is in London (04:02:44).
Our advice to those in need of ambulance services
With NHS services understandably stretched, providing as much information as possible when calling 999 can help ensure the incident is properly prioritised and an ambulance is dispatched promptly. Another important part of reducing waiting times and pressure on NHS teams is ensuring that everyone understands what constitutes an emergency and when to call for an ambulance. There is guidance on the NHS website about when to call 999.
There are also things you can do while waiting for an ambulance that can assist the ambulance service when they do arrive. You should call the ambulance service back if the patient’s condition changes, or if the patient has been moved to a new location. If possible, write down the patient’s GP details and collect any medication they are prescribed, and if you can, you should inform paramedics of any allergies.
With the increased demand on ambulance services, and the pressure on paramedics and healthcare professionals to work through a large number of cases, unfortunately some patients may not receive the treatment they should.
There are thousands of clinical negligence cases each year, and while these aren’t all strictly related to ambulance services, bringing instances of medical negligence to light is necessary to raise standards of care across health services and facilities.
Here are just a few of the incidents that can result in a claim:
- A diagnosis being incorrect or unduly delayed
- Treatment not being adequate or suitable
- Symptoms ignored
- A medical device or item not functioning as it should
- An operation or procedure being carried out incorrectly
If you think you have been the victim of medical negligence and want to talk about the possibility of making a claim, you can make an enquiry online or get in touch with our expert team of clinical negligence solicitors.
Further information can also be found on our medical negligence webpage.
Our research methodology and sources
Ambulance response time data collected from NHS England Ambulance Quality Indicator, sourced from: https://www.england.nhs.uk/statistics/statistical-work-areas/ambulance-quality-indicators/
Data was analysed 26th October 2021 and covers up until the end of September 2021 (published 14th October). Mean time is featured in hours, minutes, and seconds (00.00.00)
*Based on NHS definitions:
- C1: Calls from people with life-threatening illnesses or injuries such as cardiac arrest or serious allergic reaction (fastest response)
- C1T: Calls from people with life-threatening illnesses or injuries such as cardiac arrest or serious allergic reaction where the patient was transported (fastest response)
- C2: Emergency calls for conditions and injuries such as burns, epilepsy and strokes (high priority)
- C3: Urgent calls for conditions and injuries such as late stages of labour, non-severe burns, and diabetes. Transportation to A&E may not be required
- C4: Less urgent calls for conditions such as diarrhoea and vomiting and urine infections. Advice via phone / GP referral may be recommended over the phone.
- C1 / C1T = Most urgent, fastest response required
- C2 = Second most urgent
- C3 = Third most urgent
- C4 = Least urgent
We’re here to help with your NHS negligence claim
If you or someone you know has been affected by ambulance response times, get in contact with our team of specialist medical negligence solicitors. We are here to listen to you and provide you with the care and advice you need.
You can make an online enquiry, request a callback at a time that suits you, or call us on 0800 234 3234